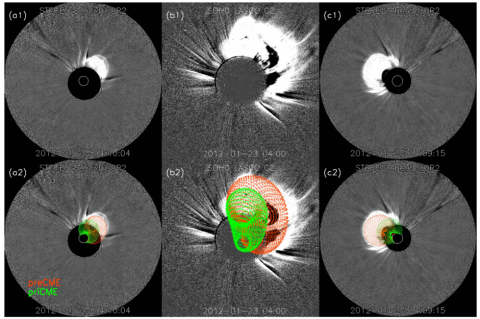
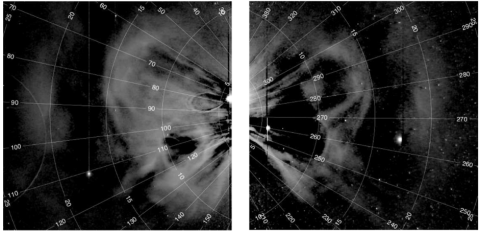
With the aid of the Extreme-Ultraviolet (EUV) instruments from the Solar Dynamics Observatory (SDO) and the Solar and Terrestrial Relations Observatory (STEREO), and the white-light coronagraphs and heliospheric imagers from the SOlar and Heliospheric Observatory (SOHO) and STEREO, CMEs can be tracked and investigated continuously from the low corona to the high corona (Figure 2), and in to interplanetary space (Figure 3). These data products are also complemented by ground-based and spaceborne instruments observing in other wavelengths (X-Ray, radio emission), and by measurements of the magnetic field at the solar surface (i.e. the photosphere). The UNH/CME group combines these different kinds of observations to study, for example, the CME global expansion, the CME acceleration (associated with magnetic reconnection), and the evolution of CMEs and their magnetic and thermal parameters due to the interaction with the solar wind or other solar transients, e.g., other CMEs (Figures 1 and 2), or stream interaction regions (SIRs).
The launch of the STEREO twin spacecraft in 2006 completely redefined the interpretation of remote-sensing CME observations. Multi-viewpoint observations led to the development of a variety of theoretical and empirical models to help further understanding the 3D characteristics of CMEs, which are one of the UNH/CME group’s main research interests. The techniques used within the group include, e.g., the tangent-to-a-sphere stereoscopic method (Lugaz et al., 2010) to analyze the CME 3D kinetic parameters, and the graduated cylindrical shell (GCS) model to reconstruct the CME 3D morphology (Figure 1). Models evaluating the CME physical parameters are also critical to achieve more accurate predictions of the CME properties at relevant impact locations in the solar system (e.g. Earth, Mars).

Figure 2. Reconstruction of two CMEs on 23 January 2012 using the GCS model. Upper panels: remote-sensing observations by the STEREO-B/SECCHI COR-2, SOHO/LASCO C3 and STEREO-A/SECCHI COR-2 coronagraphs. Lower panels: the reconstructed CME flux rope structures. From Zhuang et al. (2020).

Figure 3. Background-subtracted images of the two interacting CMEs observed on 25 May 2010 in HI-1 on board STEREO-A (left) and STEREO-B (right). From Lugaz et al. (2012).